

The Pricing Insights dashboard serves as a valuable tool for enhancing your pricing strategies. It provides a hyper-local analysis, displayed on an interactive scatter plot that is updated on a weekly basis. This analysis allows you to compare various property statuses, including Closed, Actives, Pending, Withdrawn and Expired listings. It’s important to clarify that while Pricing Insights is a powerful tool, it doesn’t replace the Comparative Market Analysis (CMA); instead, it effectively complements the CMA report.
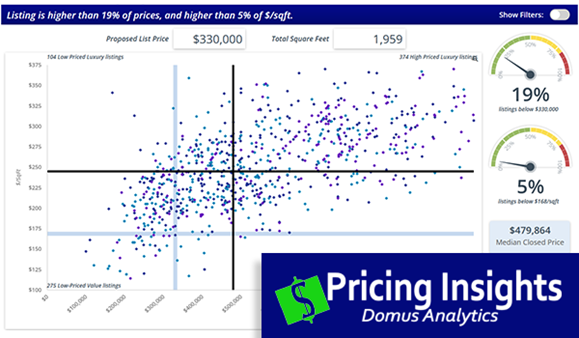
You can access the Domus Analytics Dashboard from your Flexmls Menu. Once inside, Pricing Insights offers you the flexibility to apply filters based on property type, region and status, tailoring the analysis to your specific needs. The intersecting black lines on the plot represent the middle of the market, determined by the median sales price and median price per square foot. You can use the Proposed List Price and Total Square Ft fields to determine where a specific listing stands in relation to the middle of the market, represented by the light blue lines.
This report can be conveniently printed or saved as a PDF for sharing with either buyers or sellers, ensuring that you make informed decisions when listing or purchasing properties at the best possible price.