Skip to content
My realMLS Account
realMLS Quick Links
Menu Toggle
My Listings
Add Listings
Change Listings
My Saved Searches
Hot Sheet
CMA
MMT Tax System
realMLS Login
Main Menu
SERVICES
Menu Toggle
realMLS Data Licensing
realMLS Provided Tools
Data Share
realMLS Listing Syndication
TRAINING
Menu Toggle
Online Training Classes
In Office Training
Training Calendar
Training Videos
Menu Toggle
realMLS Moments
Domus Analytics Training
Quick Search
Speaking of Real Estate
MMT Video Tutorials
RESOURCES
Menu Toggle
realMLS Support Options
Forms Transition
Broker Portal
Listing Data Definitions
Data Integrity Policy
realMLS Monthly Stats
FAQs
PUBLIC SEARCH
Menu Toggle
Property Search
Open Houses
Member Search
Office Search
ABOUT US
Menu Toggle
Message From Our Leadership Team
CEO Industry Update
realMLS in Action
realMLS Directors
realMLS Staff
RealMLS Brand Guide
Contact Us
JOIN realMLS
Menu Toggle
Join realMLS
Getting Started
My realMLS Account
realMLS Quick Links
Menu Toggle
My Listings
Add Listings
Change Listings
My Saved Searches
Hot Sheet
CMA
MMT Tax System
realMLS Login
Search for:
Search Button
Click To Chat
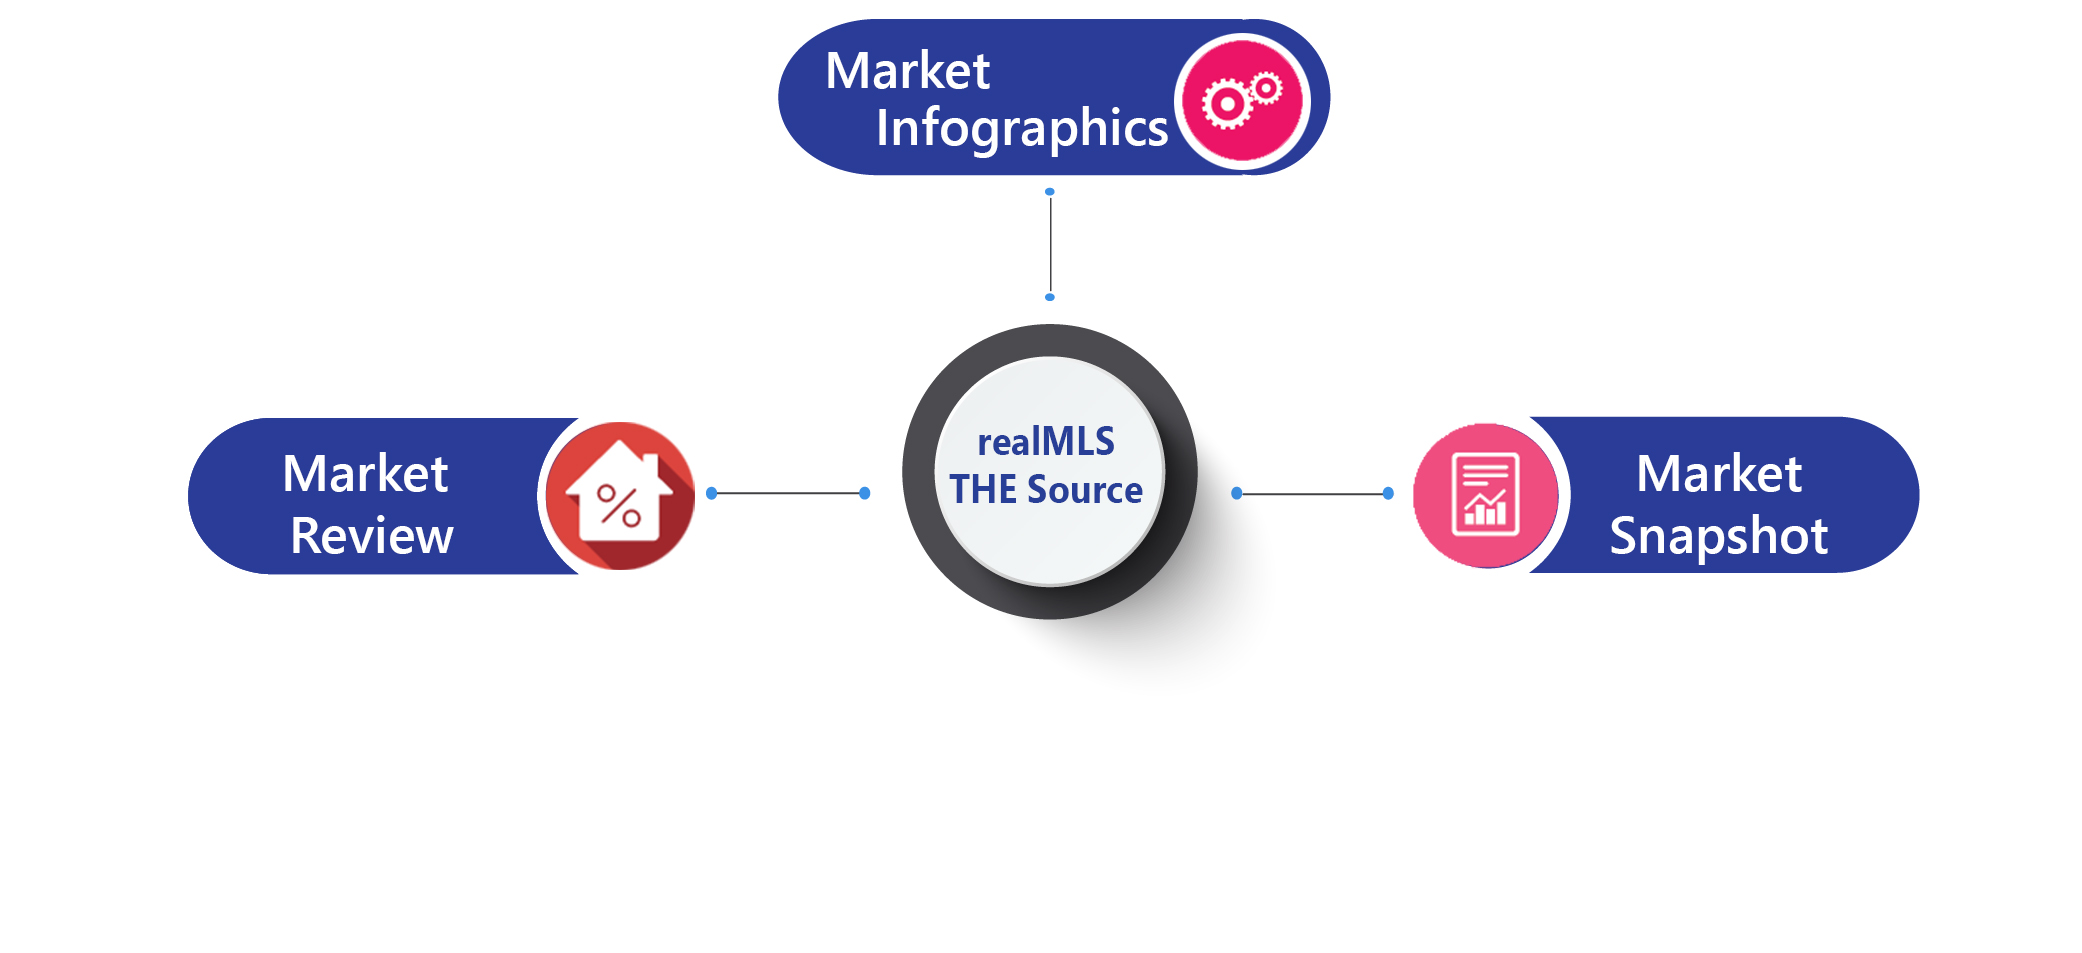
realMLS Market Statistics
These interactive reports are collected from realMLS’s database.
Scroll to Top