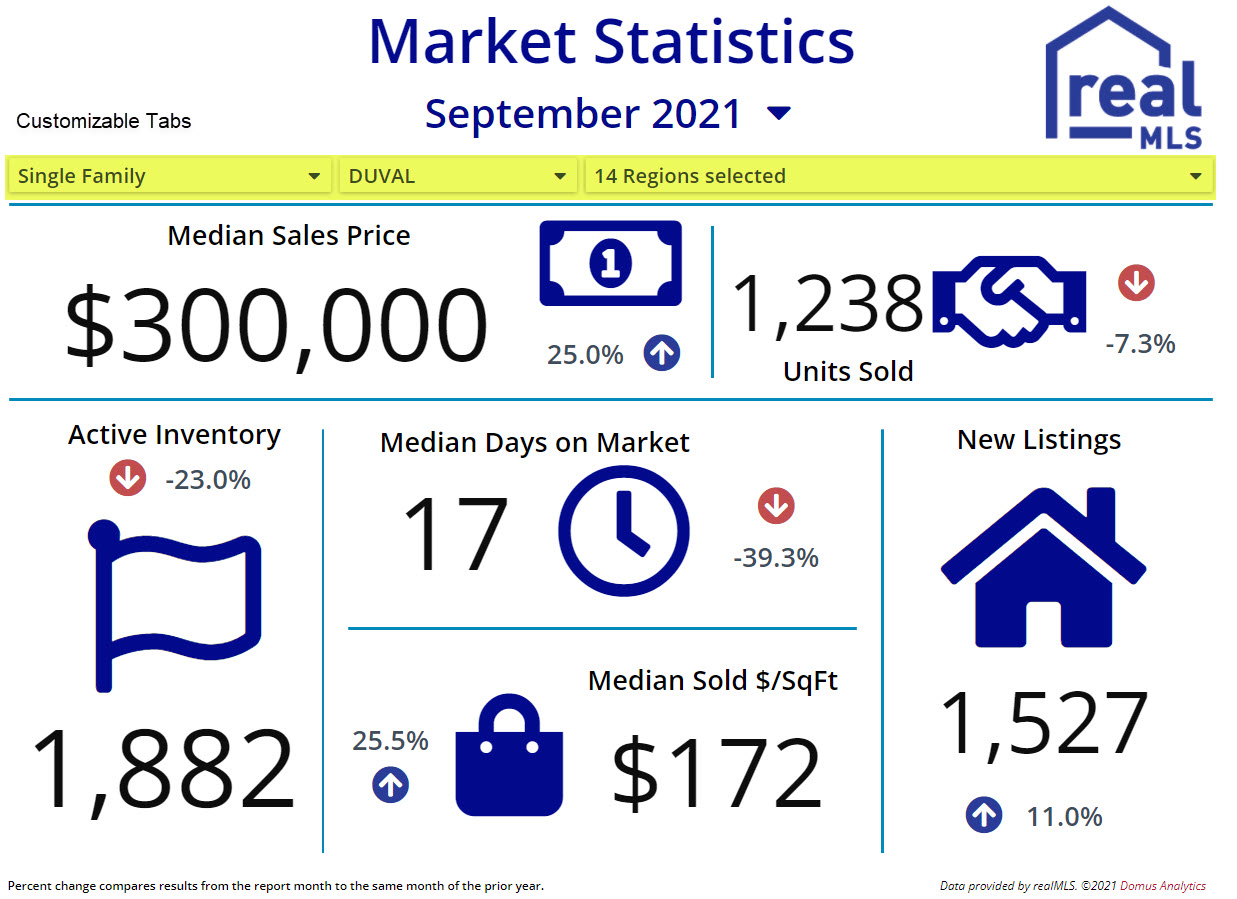
 | Domus Market Infographic is a teaser of information to encourage more discussion. Metrics include Median Price, Units Sold, New Listings, Active Inventory, Days On Market, and Price Per Sq. Foot.Plus, you can filter by Property Type and Area. |
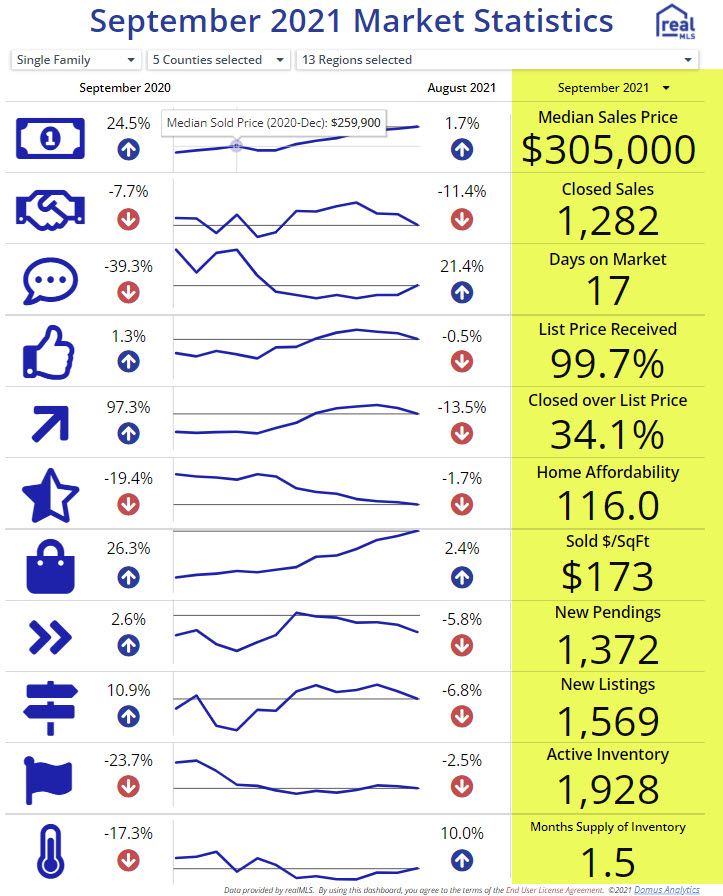 | Domus Market Review is a deep and detailed one page summary of a market. It provides a 13-month history, with the current month highlighted and percentage changes reflect Month-Over-Month and Year-Over-Year. |
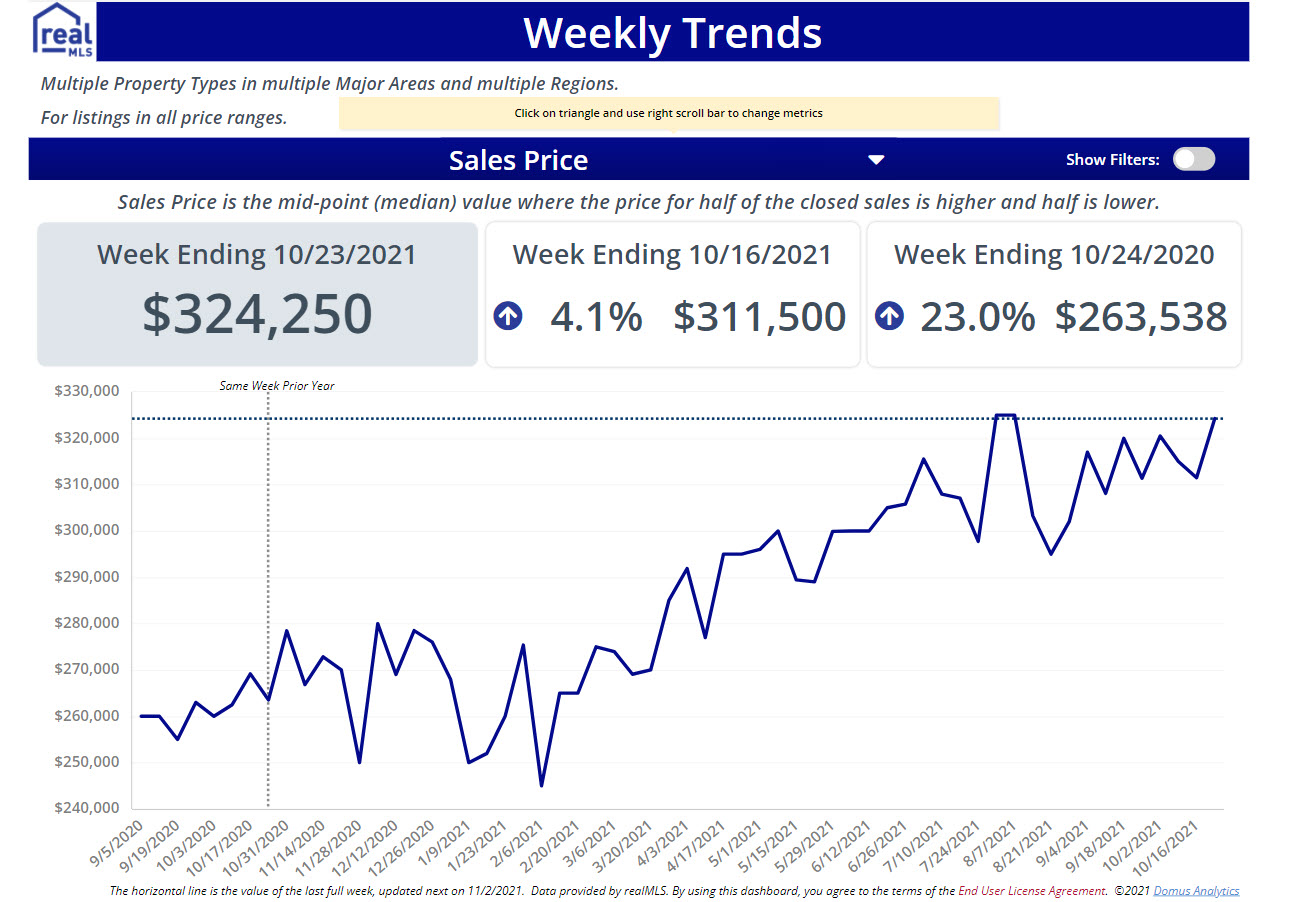 | Domus Weekly Trends tracks fast moving changes when you need market data quickly and just can’t wait for monthly data. |
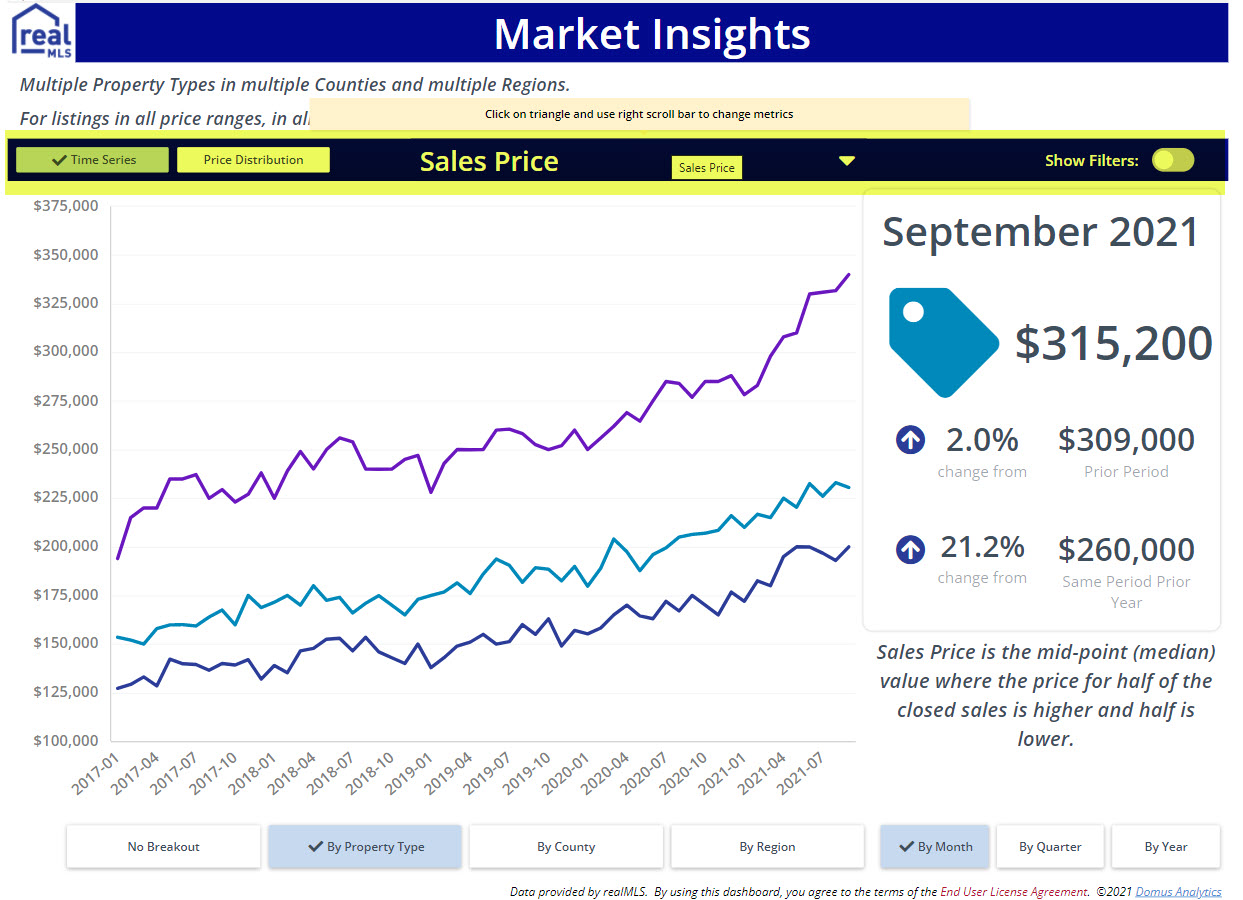 | Domus Market Insights is a high powered deep-dive into market statistics. There are multiple filters that allow you to customize your results. |
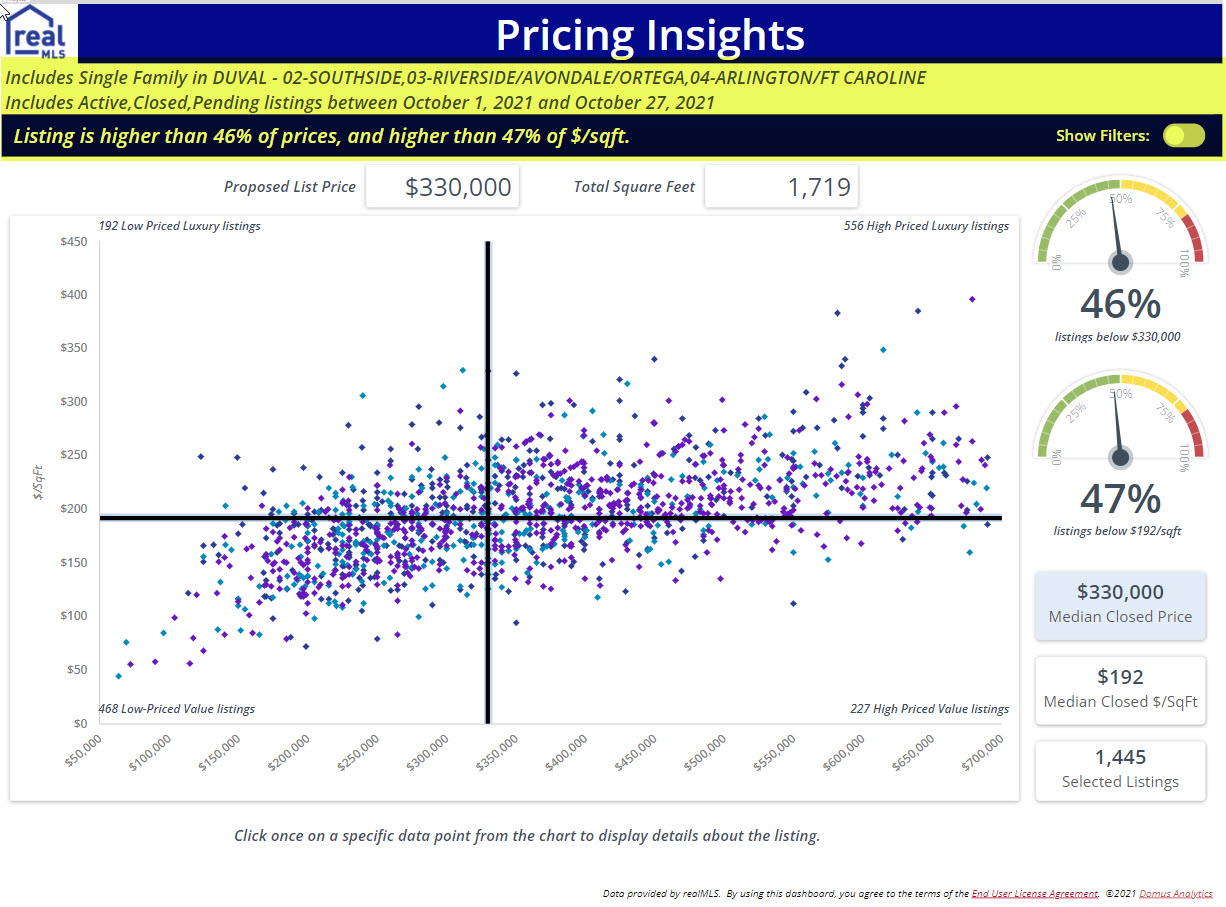 | Domus Pricing Insights visually presents the market as clients see it, it’s not an AVM or CMA. It’s a hyper-local analysis on a scatter-plot and compares Closed, Actives, Pending, Withdrawn and Expired updated weekly. |